RESEARCH TOOLKIT
  • Research Overview
    • What is Research?
    • The Research Process
  • Getting Started
    • Understanding the Assignment
    • Getting Organized
    • Finding Focus: Subject, Topic, Guiding Question
  • Gathering Info
    • Types of Information Resources >
      • GUHSD Online Databases
      • Searching Google Smartly
      • Using Wikipedia Wisely
      • GUHSD Library Catalog
    • Using Keywords for Searching
    • Taking Notes and Tracking Sources >
      • Note-Taking Strategies
  • Analyzing Info
    • Evaluating Information >
      • Avoiding Fake News
    • Developing a Thesis and Argument
    • Using Supporting Evidence
  • Presenting Findings
    • Paper/Essay >
      • MLA Format
    • Live Talk
    • Visual
    • Video/Audio
    • Website
    • GUHSD Virtual Makerspace
  • Teacher Resources
  • User Feedback Form

Presenting Findings: Visual


Presenting information visually is a valuable communication skill, and it takes a lot of work to create a visual that effectively communicates information and arguments to others. Here are some points to keep in mind regarding visual presentations.
NOTE: When creating visual works, it is common that you will use visual assets (e.g., photographs, drawings, clip art, etc.) from others. Make sure that you have rights to use assets and provide attribution, as required legally and requested by your teacher.
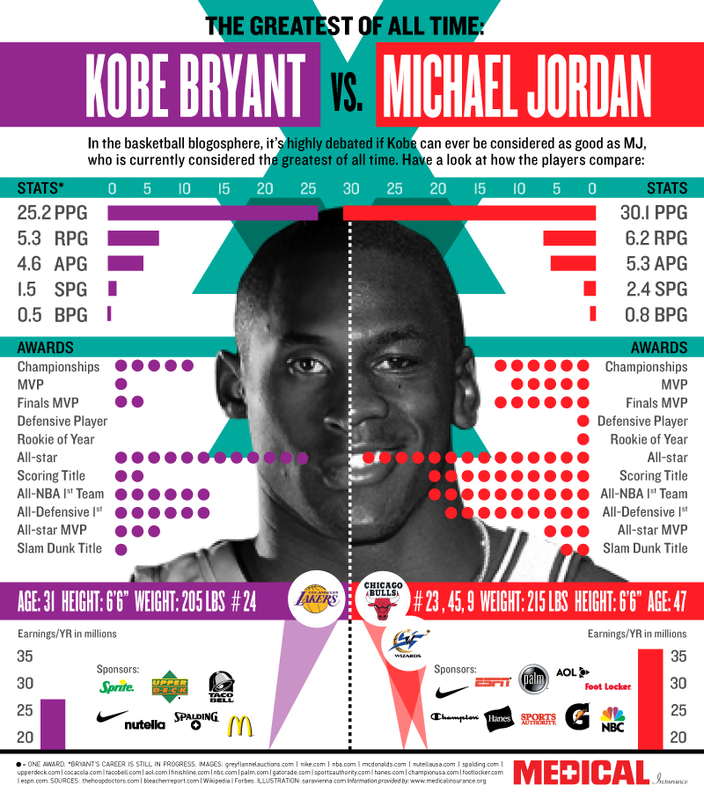
Access Gift Boxes for â€‹Free Assets to Remix
  • Visual presentations may also involve writing and/or talking to further explain your visuals and the point that you are communicating.
  • The tools for presenting visually are not limited to the possibilities shared below. Feel free to seek out and recommend other creative ways to visually represent your research findings.

Infographics

Venngage
Google Drawing
Piktochart
Canva
Infographics give you practice creating images that represent research findings, allowing you to create graphics that represent processes, relationships, arguments, and more.

Just consider how much thought and planning is required to create an image like the one comparing Kobe Bryant and Michael Jordan! 
Kobe Bryant vs Michael Jordan infographic sample

Slides

Prezi
PechaKucha
Emaze
Google Slides
Having slides accompany a presentation is a common way to share research findings. However, that doesn't mean you have to settle for developing slides the same way that they did back in the 1990s! ​Try creating dynamic slides to bring your research findings to life!
Collage of logos for Prezi, emaze, Google Slides, PechaKucha - Many, many more available online!
​There are only a few slide-making platforms that are available online. Find the slide-making tool that works best for you and create something captivating!

HOW ABOUT A
VIDEO INSTEAD?
Powered by Create your own unique website with customizable templates.
  • Research Overview
    • What is Research?
    • The Research Process
  • Getting Started
    • Understanding the Assignment
    • Getting Organized
    • Finding Focus: Subject, Topic, Guiding Question
  • Gathering Info
    • Types of Information Resources >
      • GUHSD Online Databases
      • Searching Google Smartly
      • Using Wikipedia Wisely
      • GUHSD Library Catalog
    • Using Keywords for Searching
    • Taking Notes and Tracking Sources >
      • Note-Taking Strategies
  • Analyzing Info
    • Evaluating Information >
      • Avoiding Fake News
    • Developing a Thesis and Argument
    • Using Supporting Evidence
  • Presenting Findings
    • Paper/Essay >
      • MLA Format
    • Live Talk
    • Visual
    • Video/Audio
    • Website
    • GUHSD Virtual Makerspace
  • Teacher Resources
  • User Feedback Form